Back to Projects
BI Reporting

D2C Sales Insight Project

This project analyzes sales performance across different products, markets, and timeframes. It uses Power BI for dynamic reporting, helping identify sales trends and business opportunities.

April 2025
D2C Sales Insight Project

About This Project

Analyzed sales performance across products, regions, and timeframes to uncover trends and business opportunities.

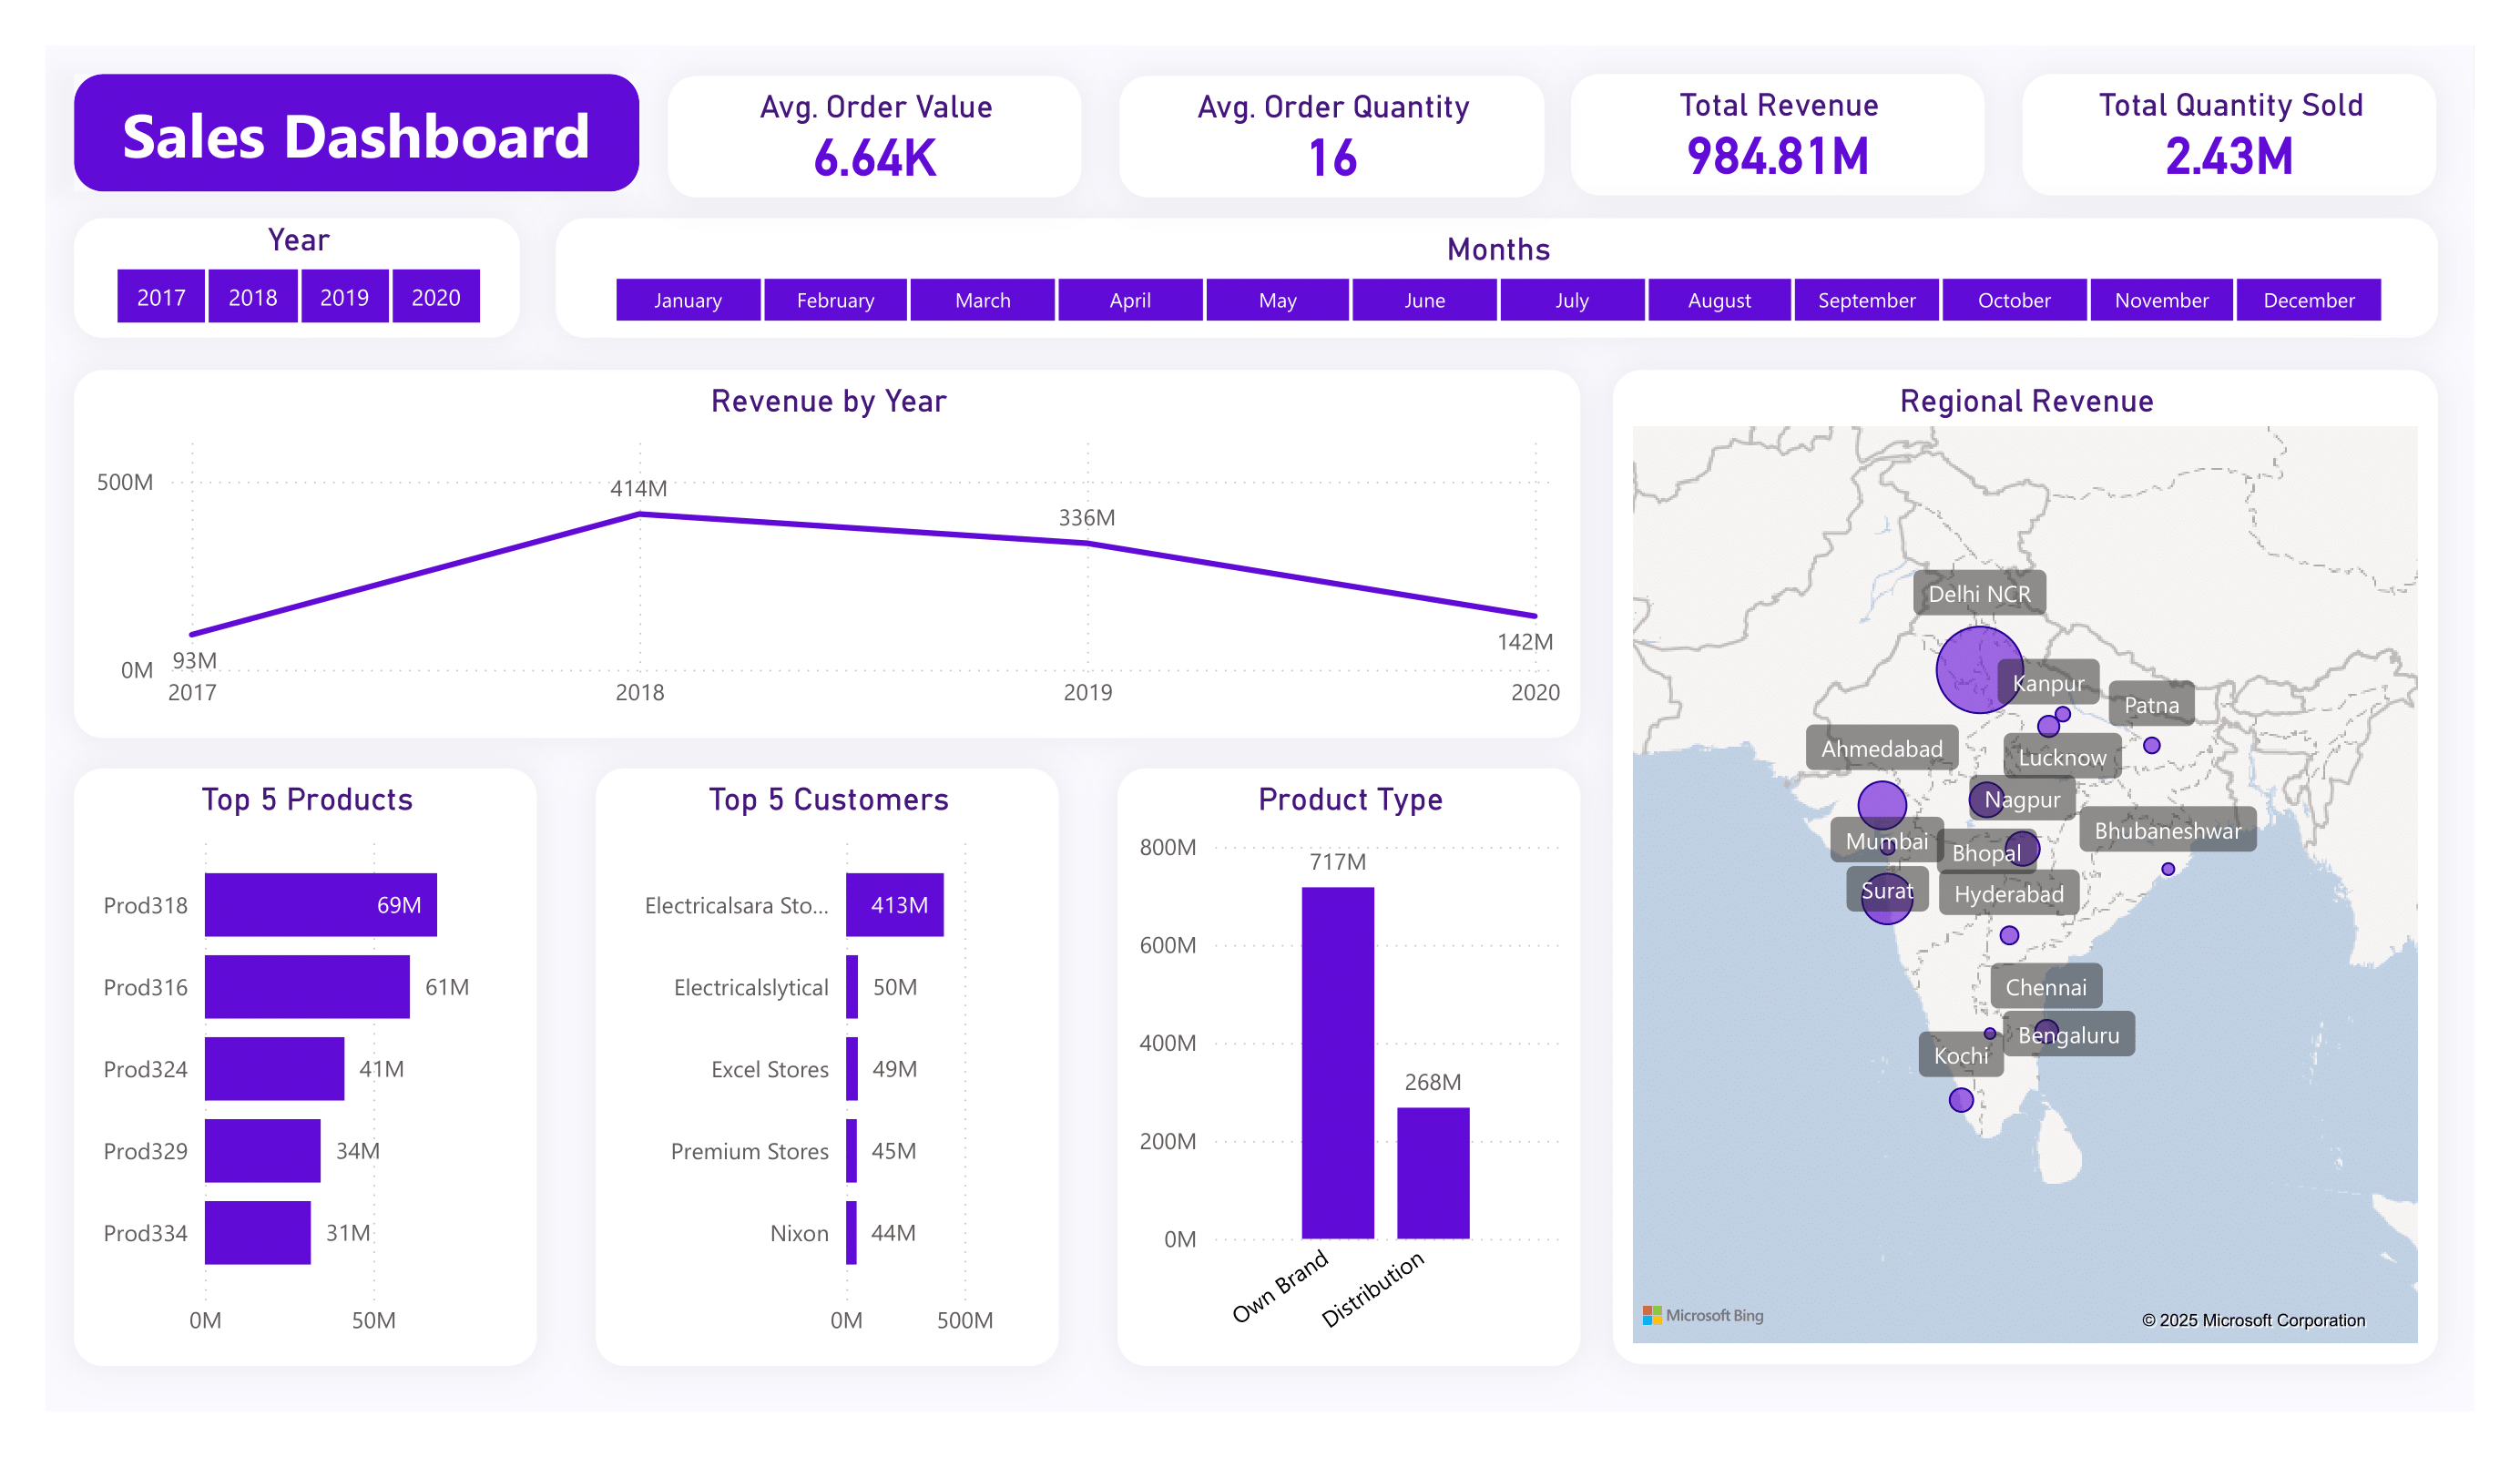
Built an interactive Power BI dashboard that highlights key sales metrics and answers strategic questions such as year-on-year revenue growth, top performing regions, best-selling products, and highest-value customers.

The project involved importing a SQL database dump into MySQL, preprocessing and cleaning data (handling date formats, nulls, and formatting), creating calculated measures (like Average Order Value, Total Revenue, and Quantity Sold), and visualizing findings in Power BI to support data-driven decision-making.

Key outcomes included

Developed a dynamic Power BI dashboard with KPI cards, bar charts, and maps to monitor overall sales performance, regional performance, and product/customer rankings.
Created calculated metrics such as Average Order Value, Average Order Quantity, Total Revenue, and Quantity Sold to support deeper performance analysis.
Identified that total revenue reached 984.4M with 2.4M products sold, but year-on-year revenue has been declining since 2018.
Revealed that Delhi, Mumbai, and Ahmedabad are top markets, and that one customer (“Electricalsara Stores”) contributes ~50% of revenue, indicating high sales concentration.
Recommended diversifying the customer base to reduce dependency, targeting low-performing regions with increased marketing focus, and promoting top-selling products more aggressively to boost growth.

Technologies Used

MySQLPower BI

Gallery